
The growing risks of storm surges in Metro Vancouver are of great concern, given the rising sea level rises amongst other adverse climate effects such as the changing atmosphere and winds. This analysis looked into how storm surge could have large impacts on different infrastructure and landmasses in the region.
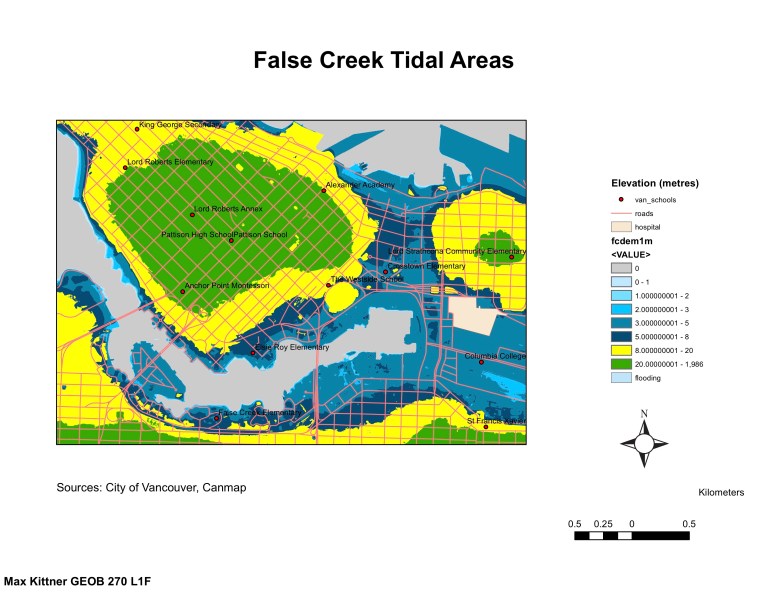
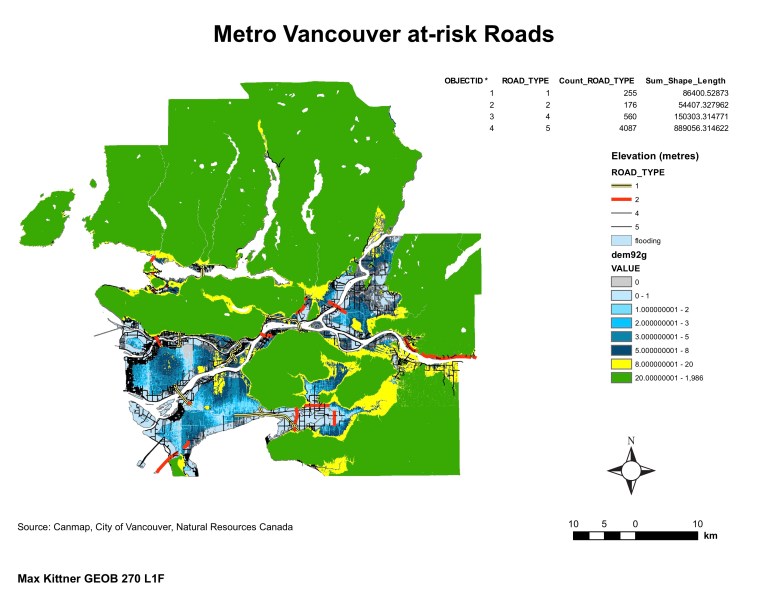
The central component was identifying and highting land that was 5 metres or less in elevation and a distance up to a kilometre of shoreline. The maps denoted the different components of the analysis: the first focusing on the elevation of land, the second highlighting the 5 metre/1 kilometre boundary, the next highlighting the roads affected, and lastly focusing on false creek flats area. With the exception of the last map, the data is sourced from a DEM that has a relatively mediocre 25-metre resolution. This gives good ideas of areas within the entire region, but in the False Creek map, a more precise DEM is used with a 1-metre resolution. This shows more accuracy in flood-prone areas. Other considerations come with the school and street data which shift and change all the time as the city develops.
In Summary:
- I used spatial and tabular datasets to compile and find areas in Metro Vancouver that are at risk of flooding.
- Learned how to reclassify DEMs and buffer zones based on attributes.
